
General Reports
The General Reports section in Zamdit provides a comprehensive suite of customizable reports that offer actionable insights into your recruitment process. These reports help you track key metrics, optimize hiring strategies, and make data-driven decisions. Customization options ensure that the data displayed is relevant to your needs, enabling you to focus on the most critical areas of your hiring efforts.
Overview
Selecting the Report
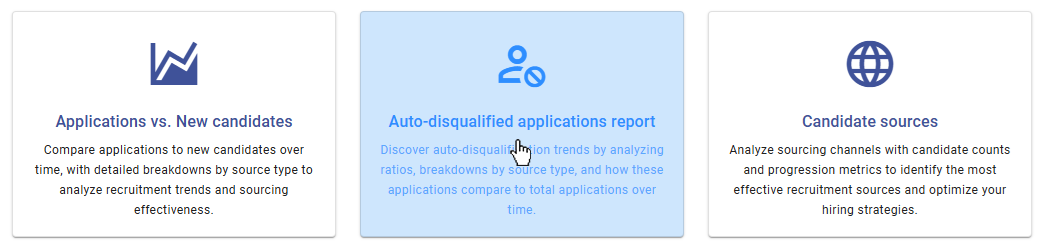
The "Reports" section displays all available reports as cards. Each card includes an icon, the report title, and a brief description, giving you an at-a-glance understanding of what the report covers. To view a report, simply click on the desired card, and you will be redirected to the Report Viewer page, which will automatically render the report using the most recent or default settings.
Report Viewer
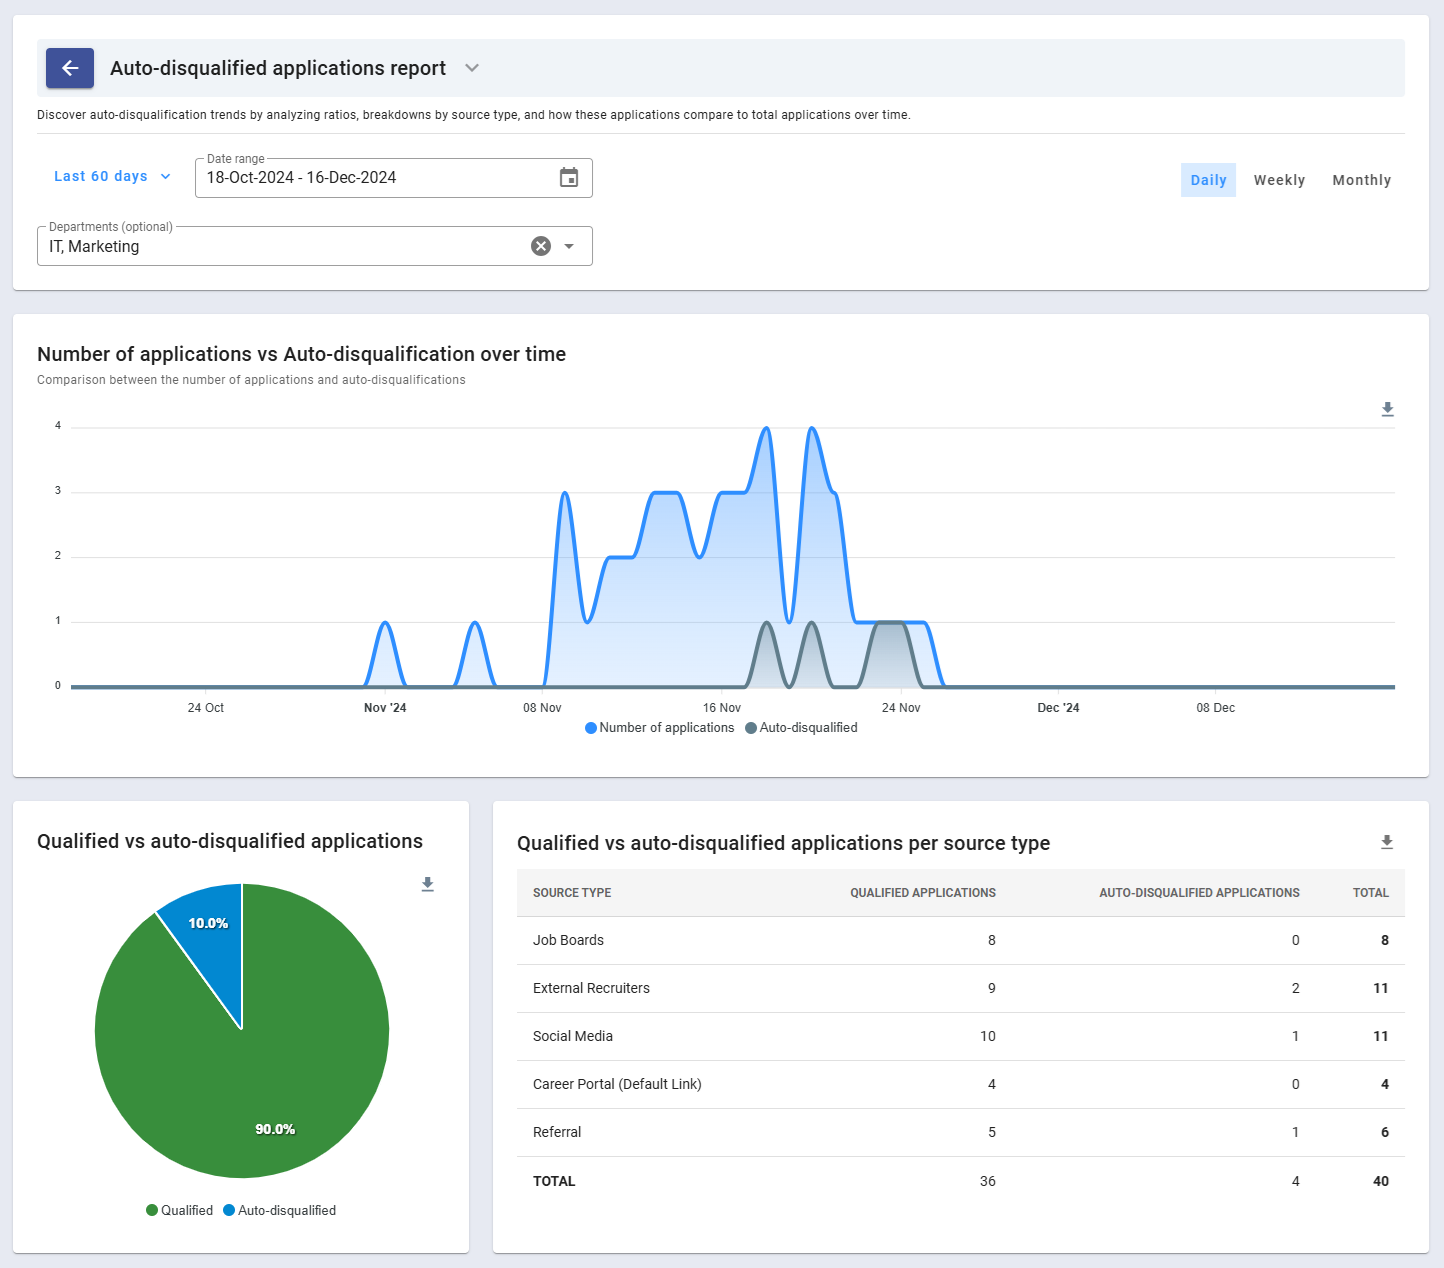
The Report Viewer provides a detailed interface for exploring and analyzing data. At the top of every report, the header section displays the report's name, a brief description, and customization inputs. Reports in Zamdit support multiple visualization formats, including:
- Area Chart: Ideal for tracking trends over time.
- Column Chart: Useful for comparing categories.
- Pie Chart: Provides a clear breakdown of percentages.
- Tabular View: Displays raw data in a detailed and structured table format.
Exporting options are readily available for charts and tables. Charts can be downloaded as SVG, PNG, or CSV (data only), and tables can be exported as CSV files. Additionally, the Chevron icon next to the report name allows you to switch between reports without navigating back to the main reports list, streamlining your workflow.
Customizing the Report
Each report includes parameters tailored to the type of data displayed, enabling you to refine the report to meet your specific needs. Common customization options include:
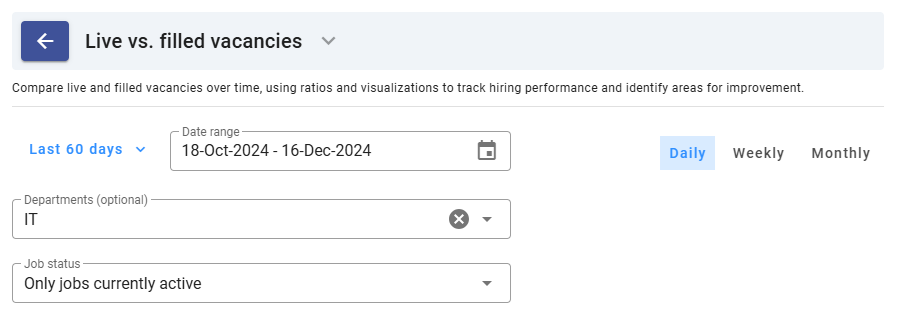
- Date Range: Choose from predefined ranges (e.g., Last Month, Last 60 Days) or set a custom date range.
- Time Frame: Adjust the granularity of the data to display trends on a Daily, Weekly, or Monthly basis. Available for reports featuring Area Chart views.
- Departments: Filter data by specific departments. Reports already broken down by department do not include this option.
- Job Status: Focus on data for jobs in specific statuses, such as Active, Complete, or All. This filter is only available for relevant reports.
These options ensure that you can tailor reports to display the most meaningful data for your analysis.
Available Reports
Zamdit offers a variety of reports organized into three categories: Candidates and Applications, Jobs, and Teams. Each report provides valuable insights to optimize your recruitment efforts.
Candidates and Applications
These reports focus on candidate activity and application trends:
- Applications vs. New Candidates: Track the number of applications versus new candidates over time. Includes a Pie Chart and a table breaking down values by source type, helping you evaluate the ratio of repeat applicants to new ones.
- Auto-Disqualified Applications Report: Analyze the ratio of auto-disqualified applications to total applications over time. Also provides a breakdown of qualified and auto-disqualified applications by source type.
- Candidate Sources: Gain insights into the effectiveness of your sourcing channels. This report shows the number of candidates per source and their progression through the hiring pipelines.
- Candidates per Job: View a detailed breakdown of candidate numbers per job, including how many applied and their progression through each pipeline stage.
Jobs
These reports provide a deeper understanding of your job postings and their performance:
- Time to Hire: Examine the average time taken to fill and hire positions. Includes a Pie Chart comparing the average time to hire versus the time since the job was posted and candidates applied.
- Historic Pipeline: Track the percentage of candidates advancing through each pipeline stage across all filtered jobs, providing insights into stage effectiveness.
- Live vs. Filled Vacancies: Compare the number of live vacancies to filled ones over time. A Pie Chart also highlights the ratio of filled to live vacancies.
- Jobs per Department: Analyze the distribution of jobs across departments, with additional metrics on how candidates progressed for each department.
Teams
These reports focus on hiring team activity and referral networks:
- Job Teams: Review general information about hiring team sizes by department. Includes a Column Chart comparing average team sizes across departments, helping you identify staffing patterns.
- Referrals: Assess the success of your employee referral network. Provides totals by department and user, along with insights into candidate progression from referral sources.
- External Recruiters: View a breakdown of activities by external recruiters, along with metrics showing how well their candidates progressed through the pipelines.
- Activity Summary: Summarizes common activities performed by hiring teams and candidates, broken down by department, to highlight team engagement and candidate activity trends.
Conclusion
The General Reports section in Zamdit empowers you with the tools needed to analyze every aspect of your hiring process. By leveraging the customizable parameters and diverse visualizations, you can make informed decisions that improve efficiency, optimize recruitment strategies, and enhance overall outcomes.