Progress Board - Reports
The Reports section in the Progress Board provides users with detailed analytics and data visualizations to assess the performance and progress of their hiring processes. This section includes six customizable reports that cover key aspects such as candidate progression, team activity, and sourcing effectiveness. By leveraging clear metrics and trends, hiring teams can identify opportunities for improvement, make data-driven decisions, and optimize their recruitment strategies for better outcomes.
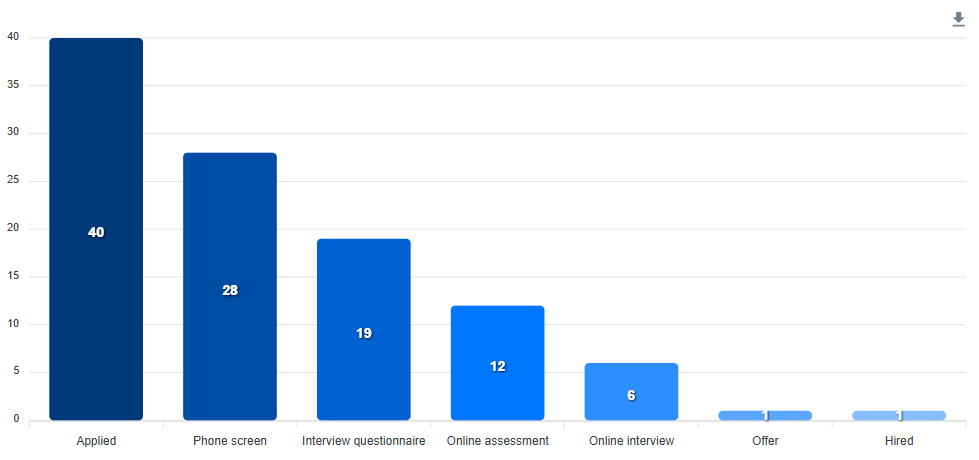
Recruitment Funnel
A column bar chart that visually represents the progression of candidates through the various stages of the hiring process, from initial application to final hire. Each column shows the number of candidates who reached the corresponding stage, helping you pinpoint where candidates may drop off.
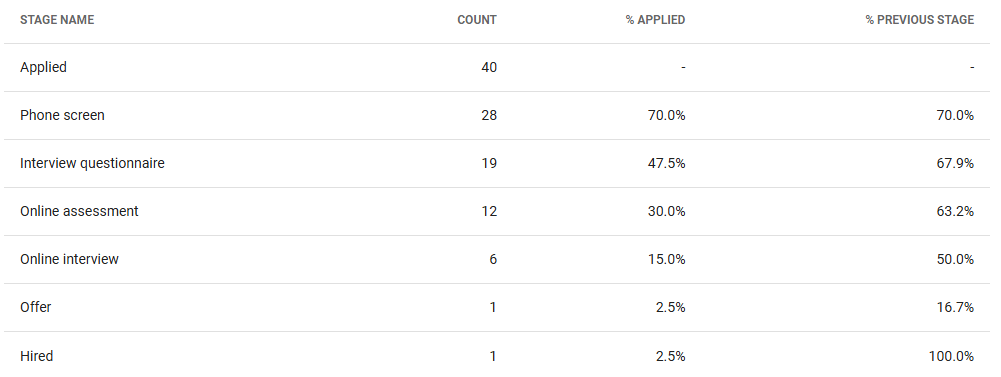
Pipeline Progression
A tabular representation of candidate progression through the hiring stages. Each row corresponds to a stage and includes:
- The total number of candidates who reached the stage.
- The percentage of total applicants who progressed to the stage.
- The percentage of candidates who moved to the stage from the previous one.
This report provides a clear, quantitative overview of your hiring pipeline.
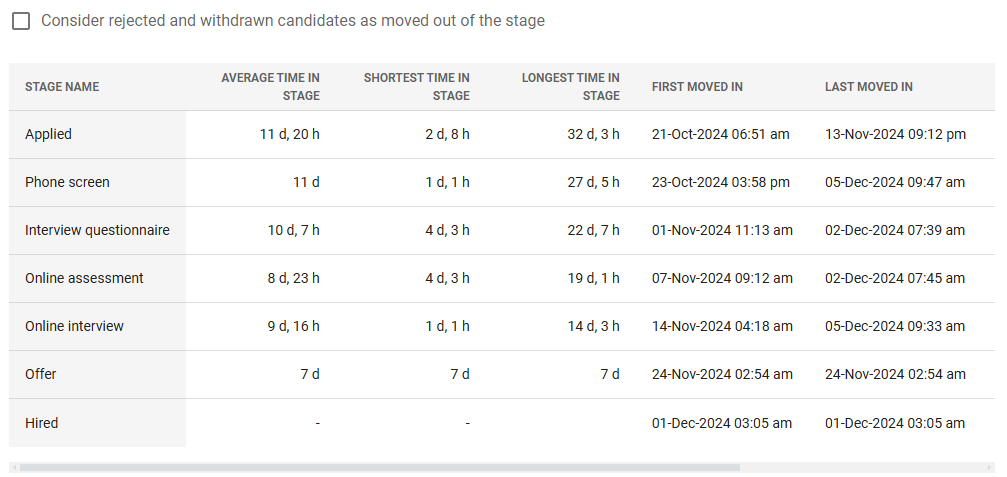
Time Spent in Stages
A table offering insights into the duration candidates spend in each stage. Metrics include:
- Average time in stage: The average duration candidates stay in the stage.
- Shortest and longest time in stage: Duration for the quickest and slowest candidates.
- First and last moved in/out: The dates and times when candidates were first or last moved into and out of the stage.
A setting allows you to include rejected and withdrawn candidates as "moved out," enabling alignment with your organization's reporting approach.
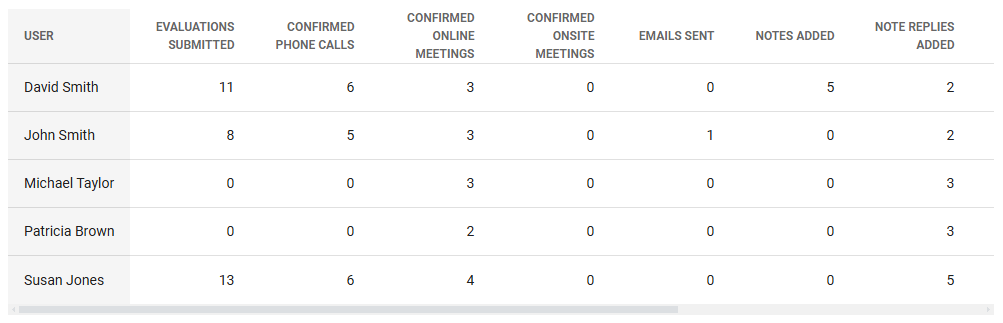
Team Activity
A table summarizing the number of activities performed by each team member. Activity types include:
- Evaluations submitted
- Confirmed appointments
- Emails sent
- Notes added
- Invited candidates
- Rejected candidates
- Candidates progressed
- Completed tasks
This report highlights individual contributions to the hiring process.
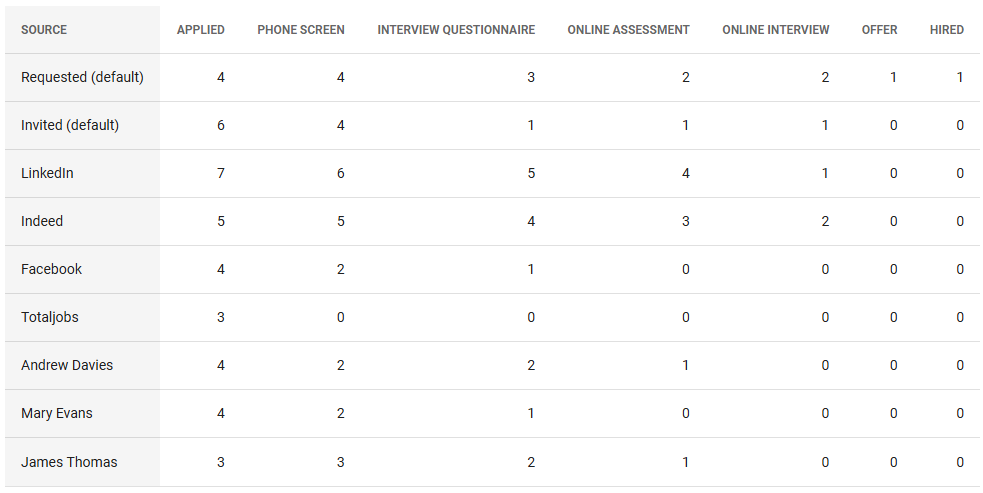
Candidates by Source
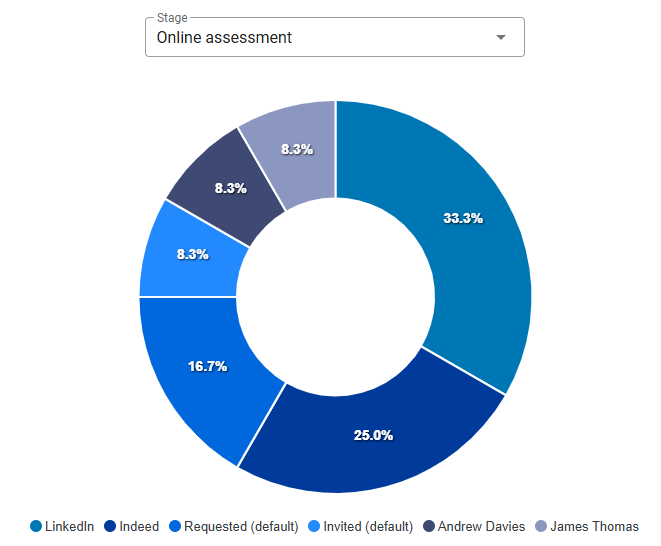
Two visualizations analyze the number of candidates reaching each stage by their source of origin. Attribution is based on the source link used by the candidates when applying. The default source is split into Requested (candidates who applied on their own) and Invited (candidates invited to apply).
The Tabular view provides a numerical breakdown of candidates who reached each stage, grouped by their source.
The Pie Chart the percentage distribution of candidates by source for a specific stage, helping identify the most effective sources.
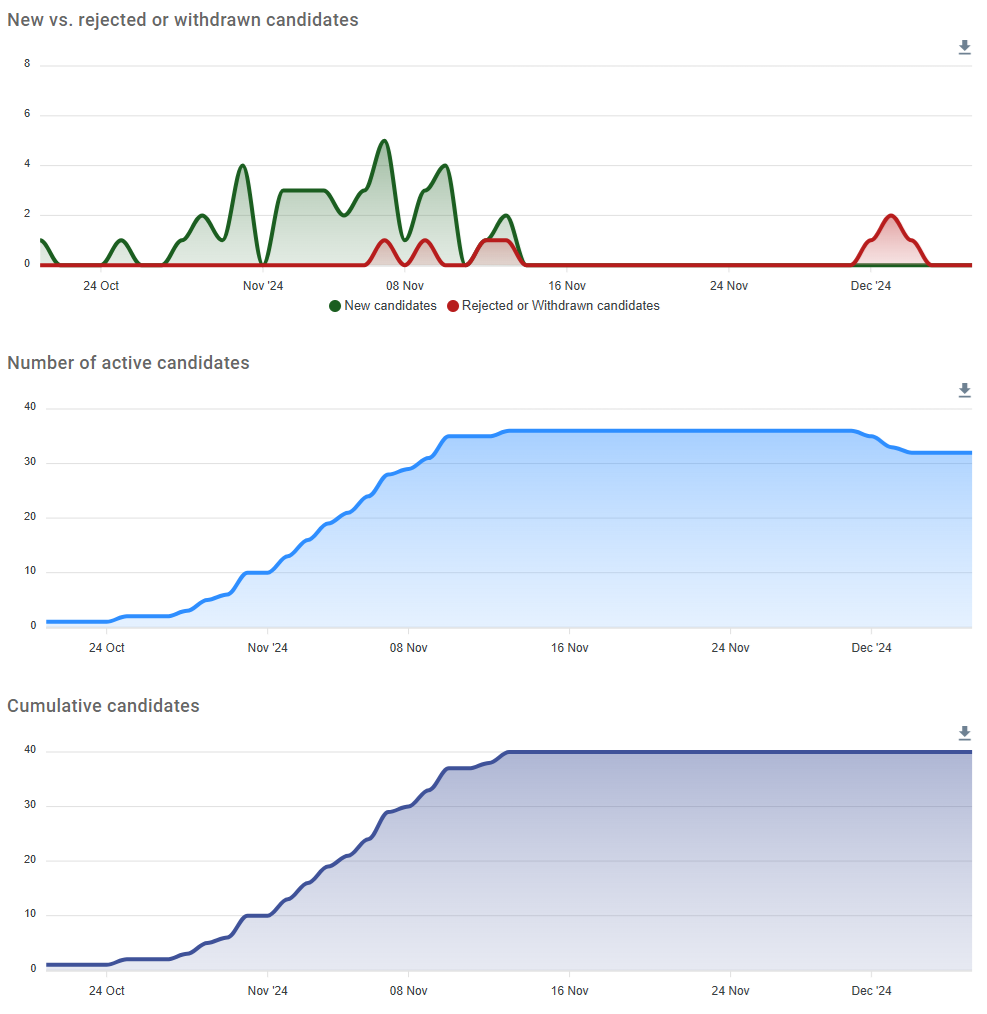
Candidates Progression
A set of charts that track candidates' status over time during the hiring process. Users can toggle between daily and weekly visualizations. These charts include:
- New vs. rejected or withdrawn candidates: Trends in candidate additions and losses.
- Number of active candidates: Daily or weekly counts of ongoing candidates.
- Cumulative candidates: The total number of candidates over time.
These charts provide valuable insights into overall pipeline health and activity trends.